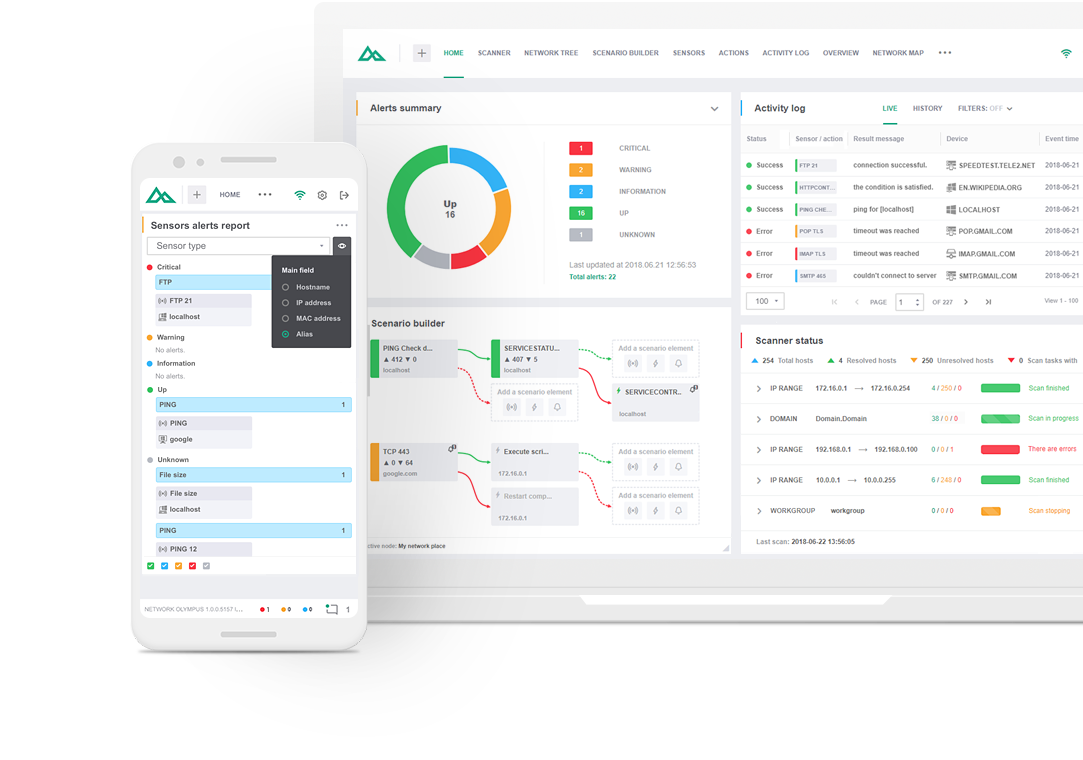

For more detailed information on each executed Sensor, Action, or Notification, there is an Activity Log widget available. The monitoring of data reports is made easier with extensive details provided for every event. The statistics stored in the database show many useful pieces of information related to every event: status, resulting message, device, involvement, etc. All of this monitoring data can be filtered by any of the entries above and included in the monitoring data reports.

This widget provides the opportunity for monitoring statistics in "Live" and "History" modes. The “Live” mode displays statistics for events executed during the current session, including data on sensors, actions, notifications, and all monitoring statistics, with the count commencing from the moment the system has been started. The historical monitoring data is stored within the "History" segment. This gives users the opportunity to obtain information about all the events that have ever occurred within the system. In both modes, it's possible to filter data by certain criteria.

The filters can be enabled and disabled to allow for a general search or a more extensive one. If a user is interested in the particular sensor or device, the following criteria can be applied:
Events. The filter shows all the events of the chosen kind that have occurred within the whole lifespan of the system’s operation. For example, only unsuccessful events can be displayed, which opens an opportunity for gathering details. In addition, a user will be able to see the comments for every event.
Sensors. Here, it is possible to apply filtering by a particular sensor type in order to check the sensor statistics on executing scans. The sensor statistics are available for review with all of the data included.
Device. To verify the efficiency of a certain device, a filter by device can be applied.
Event description. When applying filtering by the event description, events of the same type will be displayed. The filters can also be combined with each other.

All devices are given a certain color depending on the status of the event. For example, the green color is reserved for successful events, while red is used for those that did not meet the criteria. Along with color, the details of the actions will be displayed to give users a heads-up about any issues. This color will be shown in all available widgets: Activity Log, Network Map, etc. A user can assign colors manually, according to severity. For example: red for critical issues, orange for warnings, and blue for information.

Two other widgets used to generate reports are the "Sensors Alert Report" and "Actions Alert Report". These widgets can be used to display monitoring results, sorted by current status and attributes chosen by user, as well as to manage these sensors and actions. The Visualization menu allows users to further personalize the information that they want displayed about the devices.
Choose the license type that is a perfect fit for your business needs:
An unlimited number of devices for 60 days free of charge.
No activation or registration required.
All-in-one. For companies with more than 10 devices.
Includes free premium support.
No time limits. Connect up to 10 devices.
Features Take your network monitoring process to the next level by taking advantage of Network Olympus features.