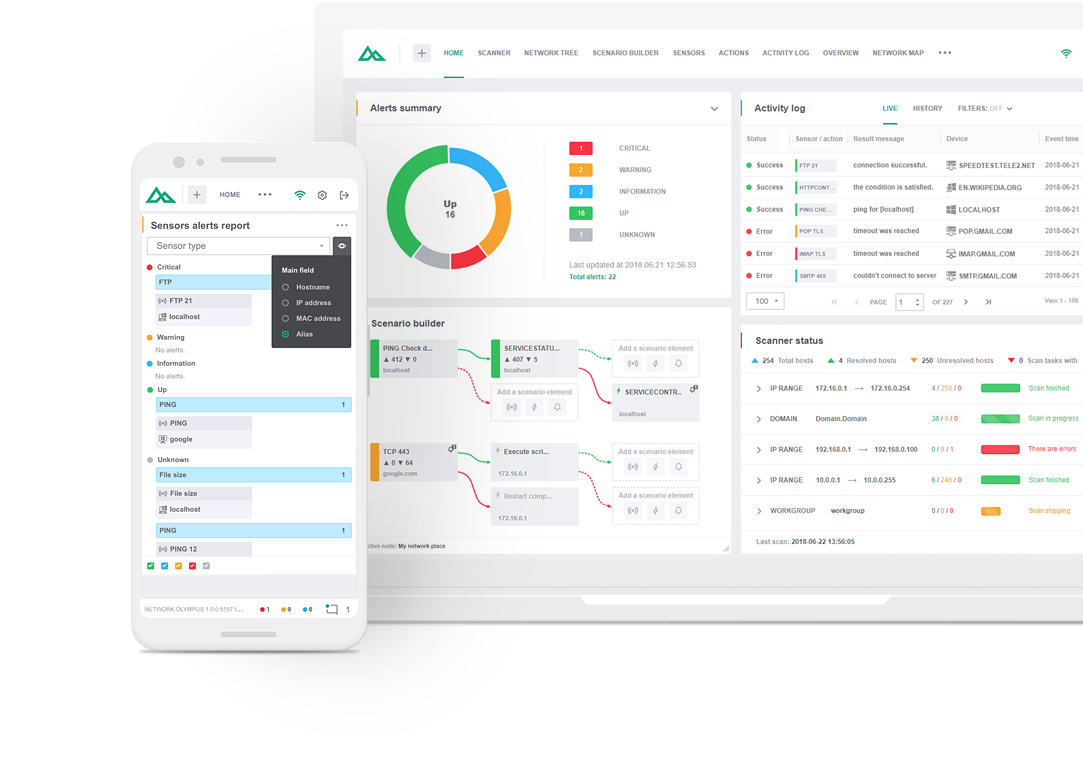

For more detailed information on each executed Sensor, Action, or Notification, the Activity Log widget is available. Monitoring reports are easier to analyze with extensive details provided for every event. The statistics stored in the database show useful information related to every event: status, resulting message, device, involvement, etc. All of this monitoring data can be filtered by any of the entries above and included in the monitoring data reports.

This widget allows you to monitor statistics in "Live" and "History" modes. The “Live” mode displays statistics for events generated during the current session, including data on sensors, actions, notifications, and all monitoring statistics, with the count starting from the moment the system is launched. The historical monitoring data is stored in the “History” section. This allows users to view information about all events that have occurred in the system. In both modes, it's possible to filter data by certain criteria.

To simplify working with device monitoring statistics, Network Olympus offers a variety of filters. If a user is interested in the particular sensor or device, the following filters can be applied:
Events. The filter shows all the events of the selected type that have occurred throughout the system’s operation. For example, only unsuccessful events can be displayed, making it easier to investigate issues. In addition, users can view the comments for every event.
Sensors. Here, it is possible to apply filtering by a particular sensor type in order to review sensor statistics collected during scans. The sensor statistics are available for review including all related data.
Device. You can filter events by device to check the status and performance of a specific device.
For maximum flexibility, all filters can be combined with one another.
All are displayed in specific colors depending on their status. For example, the green color is reserved for successful events, while red is used for failed events. In addition to the color, detailed information about the actions is displayed so that administrators can see all the details in one place. These colors are displayed across all widgets: Activity log, Network map, etc. Users can assign colors manually, according to severity. For example: red for critical issues, orange for warnings, and blue for information.

Two other widgets used to generate reports are the "Sensors alert report" and "Actions alert report". These widgets can be used to display monitoring results, sorted by current status and user-selected attributes, while also allowing users to manage sensors and actions. The Visualization menu allows users to customize the displayed information about devices.
Choose the license type that is the perfect fit for your business needs:
Monitor an unlimited number of devices free of charge for 30 days.
No activation or registration required.
All-in-one solution for companies with more than 10 devices.
Includes premium support at no additional cost.
No time limit. Connect up to 10 devices.
Other Features Take your company's network administration to the next level with with Softinventive Lab’s solutions.